
Here you can view an example of a bar chart for the IELTS test.
This bar chart shows the levels of spending of a family on three household items – gas, food and clothing.
First, note that the bar chart is over time, which means you need to use the language of change. You should also make sure that you are comparing and contrasting the items.
Take a look at the graph and model answer, then view the comments below on the response in order to see how you can improve your answers.
| You should spend about 20 minutes on this task. The bar chart shows the monthly spending in dollars of a family in the USA on three items in 2010. Summarize the information by selecting and reporting the main features and make comparisons where relevant. Write at least 150 words. |
Model Answer
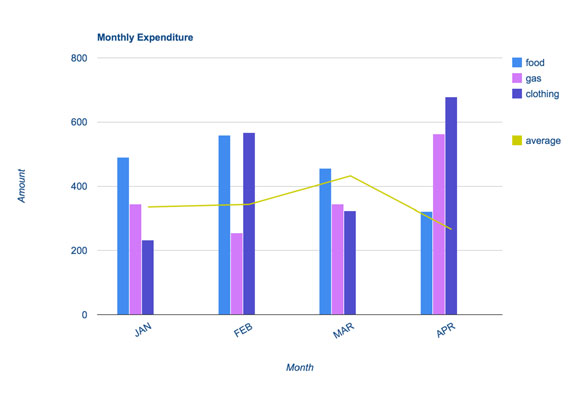
The bar chart depicts the monthly expenditure on food, gas and clothing of a family living in the USA in 2010. Overall, it can be seen that levels of expenditure fluctuated over the period.
To begin, in January the most money was spent on food, at approximately $500 per month. Although expenditure on food increased slightly the following month, it then fell to account for the lowest expenditure of all the items at the end of the period at just over $300.
Gas appeared to follow the opposite pattern to food spending. It started lower at about $350 per month, falling in the following month, and then increasing significantly to finish at just under $600 in April.
Clothing, which at just over $200 accounted for the lowest expenditure at the beginning of the period, fluctuated dramatically over the time frame. After reaching around the same levels as food in February (nearly $600), it dropped markedly in March, then jumped to just under $700 in the final month.
With the exception of an increase in March, average spending decreased slightly over the four months.
(183 words)
Evaluation of the model answer
Task Achievement: Band 8
- The response effectively describes the fluctuations in monthly expenditure on food, gas, and clothing for a family in the USA in 2010.
- The key trends and patterns are clearly identified and well-explained, including the rise and fall of expenses over time.
- However, the final statement about “average spending” is unclear, as the text doesn’t focus on overall averages—clarifying this could improve accuracy.
Coherence and Cohesion: Band 8
- The structure is logical and the flow of ideas is clear, with the description divided by expenditure category.
- Transition words such as “to begin,” “although,” “however,” and “after” are effectively used to link ideas and show contrast or progression.
- The response follows a smooth, logical progression of ideas.
Lexical Resource: Band 7.5
- A good range of vocabulary is demonstrated, including terms like “fluctuated,” “accounted for,” “increased significantly,” and “markedly.”
- Some repetition of common terms like “spending” and “expenditure” could be avoided by using synonyms to further diversify word choice.
Grammatical Range and Accuracy: Band 8
- The response uses a range of sentence structures, from simple to complex.
- The grammar is mostly accurate, though there is a slight awkwardness in the sentence “Although expenditure on food increased slightly the following month…” which could be clarified.
- The sentence structure is varied enough to keep the reader’s interest.
Overall Band: 7.5-8
The description is clear and accurate, with well-organized points and appropriate language. To enhance the response further, avoid minor ambiguities (like the final statement on average spending) and introduce more varied vocabulary.
Leave a Reply